In marketing, life, & politics, perception is often reality.
When it comes to unemployment data, the U.S. government breaks down employment trends into six separate categories: U-1 through U-6. Two of the six are key: U-3 & U-6. Also note that if the U.S. economy gains roughly 150,000 jobs, as it did in the latest November 2, 2012 updated report, we are not really gaining any jobs since roughly 150,00 American are born every month.
U-3 is partial perception and U-6 is full reality, or real unemployment. The media often reports the U-3 number. However the most telling number is U-6. These U-6 unemployment numbers are the entire novel and not just half of the first U-3 chapter. U-3 sees an economic tree; U-6 sees the economic forest.
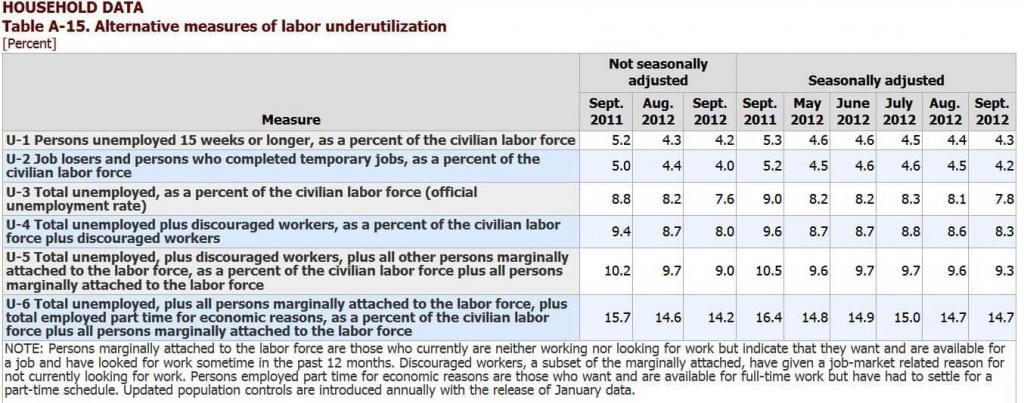
The drop in unemployment to 7.8% released October 5th, 2012, leaves out important parts of the jobs picture. It does not paint the full picture. There is no such thing as a jobless recovery, which we are now experiencing. Unemployment is actually 14.7%. But why? U-6 answers this question.*
U-3 is the tip of the iceberg; U-6 is the rest of the iceberg–the part that sinks ships and rings of reality. U-3 is partial job data and U-6 is comprehensive job data based in a broader context. U-3 tells you what you want to hear and U-6 tells you what you need to hear. Note the U-3 numbers below, but look hard at the U-6 numbers.
Bottom line: 7.8% unemployment actually equals 14.7% unemployment, or better said, underemployment. U-3 masks the full math of U-6. Unemployment dropped, not because there are more jobs, but because record numbers of people are leaving the workforce. They can’t find a job, have given up looking, or are only working part-time. The workforce participation rate is thus currently at its lowest level since 1962.
Our economy needs at least 300,000 jobs added per month, for 3 to 5 years, to merely break even with pre-recession job numbers. Even though the U.S. economy has added 4.2 million jobs since January 2008, this still puts our economy at a net loss of jobs with 23 million Americans out of work. Furthermore, many of the jobs added have been part-time, lower-wage jobs. Addition becomes subtraction until we at least break even. It’s treading water rather than forward progress.
See the full iceberg below, especially the last U-6* row of trends. Click on the chart to see a larger view:

I rarely dive into the combination of economics, politics, and marketing, but when economic “spin” impacts small businesses, and people’s lives, I can’t keep my keyboard quiet. All we hear from the media and many of the political pundits is the U-3 number. I want the big picture. U-6 gives you that picture.
By continuing to use the U-3 number, any drop in unemployment is not progress. I wish I was wrong. The government numbers speak for themselves. I prefer reality to partial spins. Your business needs the whole iceberg so you can navigate your marketing strategy, pricing, messaging, advertising, and the business decisions you face daily.
Don’t despair. Now is the time to gain share. Advertise, speak, promote, improve your website and SEO, network, Tweet, post, drive your business, and vote. Gain share now while others panic, cut back, and lose market share. Gain share now and shout your brand while others bow in fear. Be wise but bold.
Embrace the full reality of the U-6 economy. Make it work for your business. Base your marketing decisions on the forest and not the trees.
*The above chart comes from the U.S. Bureau of Labor Statistics website. For the most current unemployment numbers and more, click the link below:
http://www.bls.gov/news.release/empsit.t15.htm
* November 2012 numbers: U3 = 7.9; U6 = 14.6
Your thoughts are welcome.
Stuart Atkins


Leave a Reply